Event Tour
Reporting
The Reporting tab gives you deep analytics for a single event — registration trends over time, ticket-type breakdown, session popularity, form response analysis, revenue breakdown, and attendee demographics. Use it to understand how your event is performing and to make data-driven decisions.
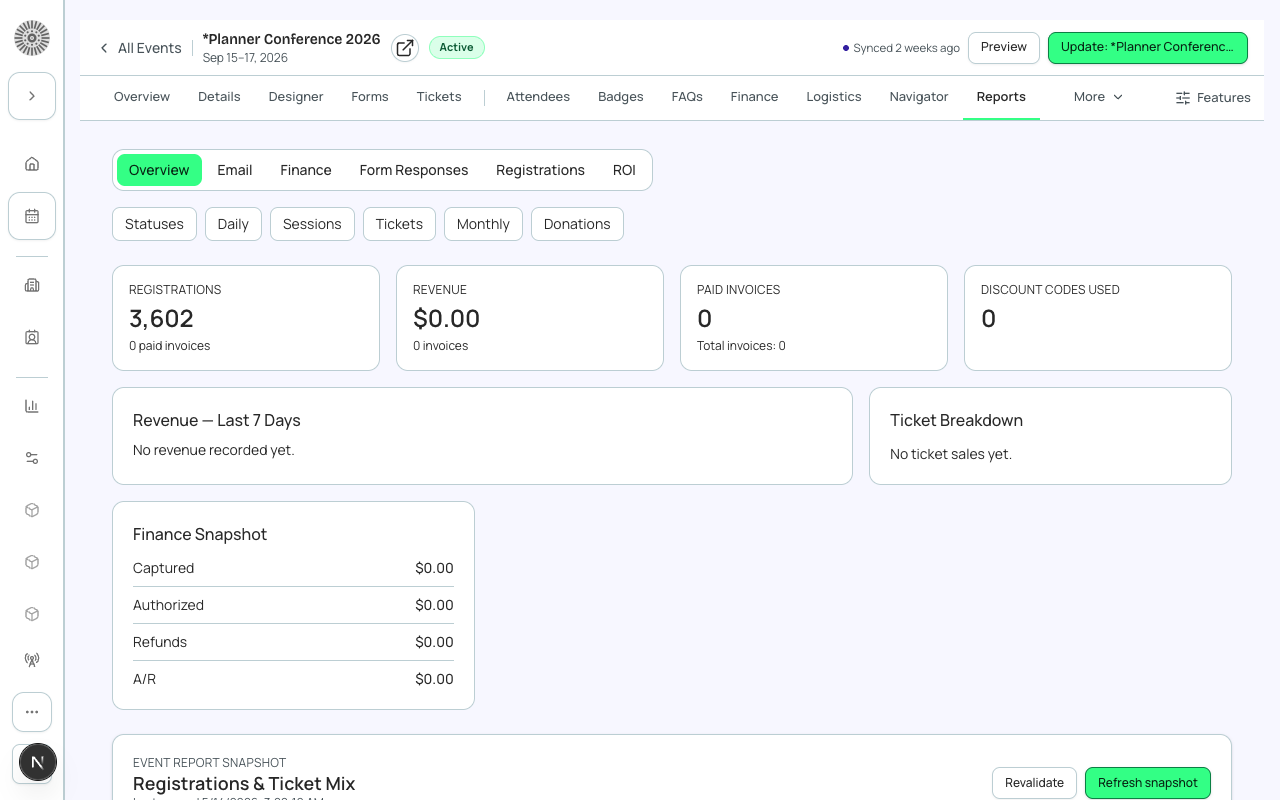
Registration Trend
The registration trend chart shows cumulative registrations over time, from the moment registration opened to today (or to the event date for completed events). Spikes typically correspond to email campaign sends, social posts, or early-bird deadline days. Hover over a point to see the exact count and date.
Ticket Type Breakdown
A donut chart shows the distribution of registered attendees by ticket type. For Planner Conference 2026 you would see slices for GA (free), each paid tier ($25–$1,499), and the Donation item. Click a slice to filter the attendee list to that ticket type.
Revenue Report
The Revenue section shows:
- Gross Revenue — sum of all completed transaction amounts.
- Refunded — sum of refunded transactions.
- Net Revenue — gross minus refunds.
- Processing Fees — total fees (absorbed or passed through).
- Revenue by Ticket Type — bar chart breakdown per ticket tier.
- Revenue over Time — line chart showing cumulative revenue.
Session Popularity
A ranked list of sessions by enrollment count, showing each session's capacity fill percentage. Use this to identify underperforming sessions that may need promotion, or oversubscribed sessions that need a larger room or a second slot.
Form Response Analysis
For dropdown, multi-select, and checkbox form questions, Forge generates distribution charts showing how many attendees selected each option. For example, if you asked 'How did you hear about us?', you see a bar chart of the response distribution.
Attendee Geography
A map view (when address data is available from the Salesforce Contact record) shows where registered attendees are coming from. Useful for planning travel accommodations or targeting future event locations.
Exporting Reports
Every report section has a CSV export button. The export respects the current filter state. Available exports: registration list, revenue by ticket, session enrollment, form responses.
Salesforce reports
All the data in Forge Reporting is also available in native Salesforce reports (conference360__Attendee__c, bt_stripe__Transaction__c, conference360__Session__c). For complex cross-object reporting or Einstein Analytics, use Salesforce directly.