Global Tour
Reporting
The global Reporting section gives you an aggregated view of performance across all events in your workspace. Use it to answer questions like 'how many registrations did we collect last quarter?', 'which events had the highest no-show rate?', or 'what is our total revenue year to date?'
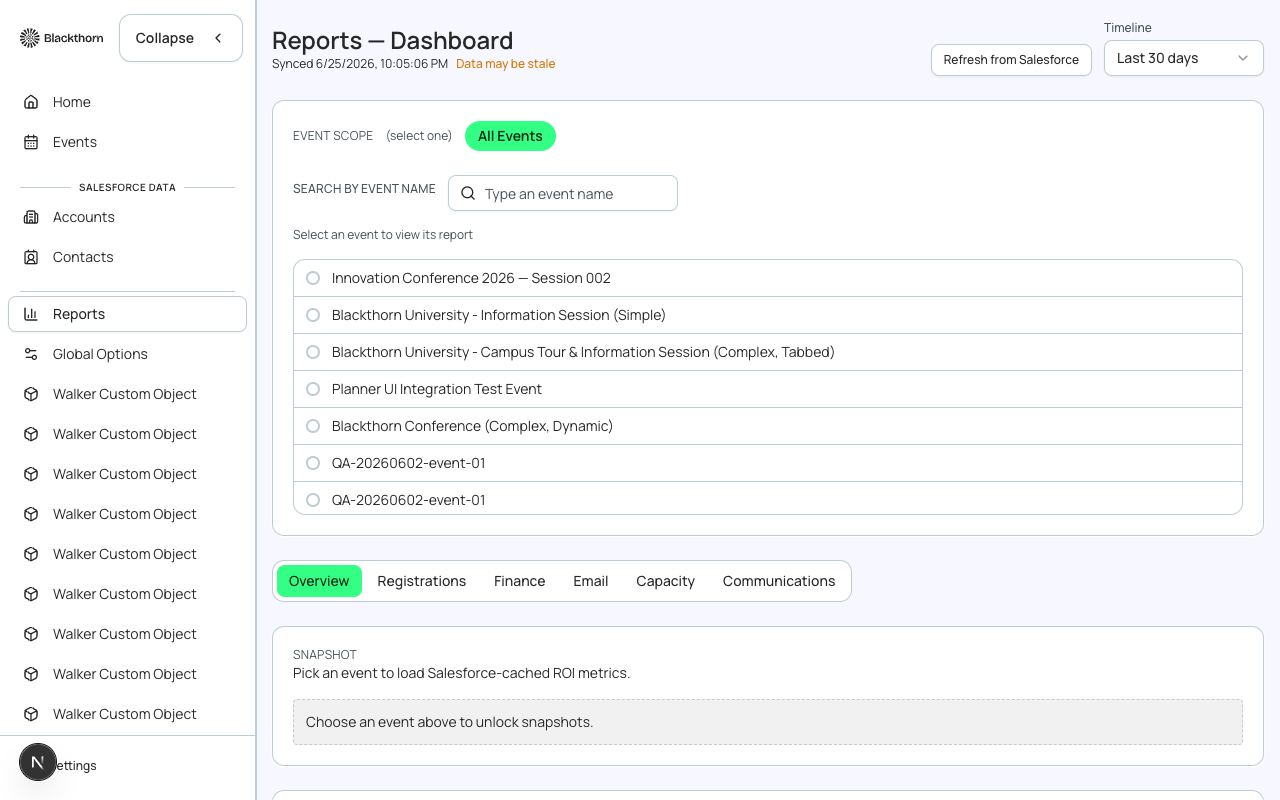
Dashboard Metrics
| Metric | Description |
|---|---|
| Total Registrations | Count of all Attendee records with status Registered, across all events in the selected date range. |
| Total Revenue | Sum of completed Transaction amounts (does not include pending or refunded). |
| Average Registration Value | Total revenue divided by total paid registrations. |
| No-show Rate | Percentage of Registered attendees who did not check in. |
| Top Events by Registrations | Ranked list of events sorted by registration count. |
| Revenue by Event | Bar chart showing revenue contribution per event. |
Filtering and Date Ranges
All global reports support date range filtering (by event start date or registration date), event group filtering, and status filtering. Use these to slice the data to the period and scope you care about.
Exporting Data
Every table in the Reporting section has a CSV export button. Exports reflect the current filter state — what you see is what you get. Large exports (over 10,000 rows) are queued and delivered to your email when ready.
PII in exports
Exported reports that include attendee names and emails contain personal data. Handle these files per your organization's data handling and retention policies.
Event-Level vs Global Reporting
Each event workspace has its own Reporting tab with deeper per-event metrics (session popularity, ticket-type breakdown, form response analysis). The global Reporting section is for cross-event rollups only.
Salesforce reporting
All Forge data is stored in Salesforce and available in native Salesforce reports and dashboards. Forge reports are a convenience layer — for complex custom reports or Einstein analytics, go directly to Salesforce.